- Shiba Inu price extends its decline on Friday after falling nearly 5% so far this week.
- On-chain data indicate that SHIB holders are offloading meme tokens as geopolitical tensions escalate.
- The technical outlook suggests a further correction as momentum indicators continue to weaken.
Shiba Inu (SHIB) extends its decline at the time of writing on Friday after dropping nearly 5% so far this week. The on-chain data supports a correction ahead, as SHIB holders are unloading tokens amid the escalating Iran-Israel war. The technical outlook indicates a potential price decline as bearish momentum remains dominant.
Shiba Inu investors' confidence fades amid Iran-Israel conflict
The ongoing Iran-Israel war, which has been taking place for more than a week, along with the uncertainty over US President Donald Trump’s tariffs, continues to weigh on risk mood. As the risk-off sentiment hits the crypto market, meme coin cryptos such as Shiba Inu could be hit the hardest due to their highly speculative nature.
Santiment Network Realized Profit/Loss (NPL) metric indicates that SHIB holders are realizing losses, suggesting a decline in investors' confidence, as it shows a massive drop from -346,000 to -211.2 million between Sunday and Monday, the highest drop since March 2024. This negative spike suggests increased selling activity, which would further bring down Shiba Inu prices.
 [10-1750399333355.47.09, 20 Jun, 2025].png)
Shiba Inu NPL chart. Source: Santiment
Santiment’s Supply Distribution shows that the number of large-wallet holders is falling. The metric indicates that the whales holding between 100,000 and 1 million (red line) and between 10 million and 100 million (blue line) SHIB tokens have decreased from Wednesday to Friday, further supporting the bearish outlook.
 [09-1750399380338.45.43, 20 Jun, 2025].png)
Shiba Inu Supply distribution chart. Source: Santiment
Shiba Inu Price Forecast: Bears in control of the momentum
Shiba Inu's daily chart shows that SHIB faced rejection from the 50-day Exponential Moving Average (EMA), which coincided with a descending trendline (drawn by connecting multiple highs since mid-May), on June 13 and declined nearly 14% until Tuesday. However, on Wednesday, SHIB rebounded slightly after finding support around its daily level at $0.000011. At the time of writing on Friday, it continues to correct, nearly at this daily support.
If SHIB closes below the daily support at $0.000011, it could extend the decline to retest the April 9 low at $0.000010.
The Relative Strength Index (RSI) indicator on the daily chart reads 34, pointing downward toward oversold conditions and indicating strong bearish momentum. The Moving Average Convergence Divergence (MACD) indicator on the daily chart showed a bearish crossover last week. It also shows rising red histogram bars below its neutral level, indicating bearish momentum and giving credence to the downward trend.

SHIB/USDT daily chart
Looking down at the weekly chart also shows bearish signs. SHIB has continued its six-week streak of red candlesticks since mid-May and has fallen nearly 5% so far this week. The RSI on the weekly chart reads 39, below its neutral level of 50, indicating strong bearish momentum. Moreover, the MACD on the weekly chart is about to flip a bearish crossover, which could further support the downward trend.
If SHIB continues its correction, it could head toward its next weekly support at $0.000011.
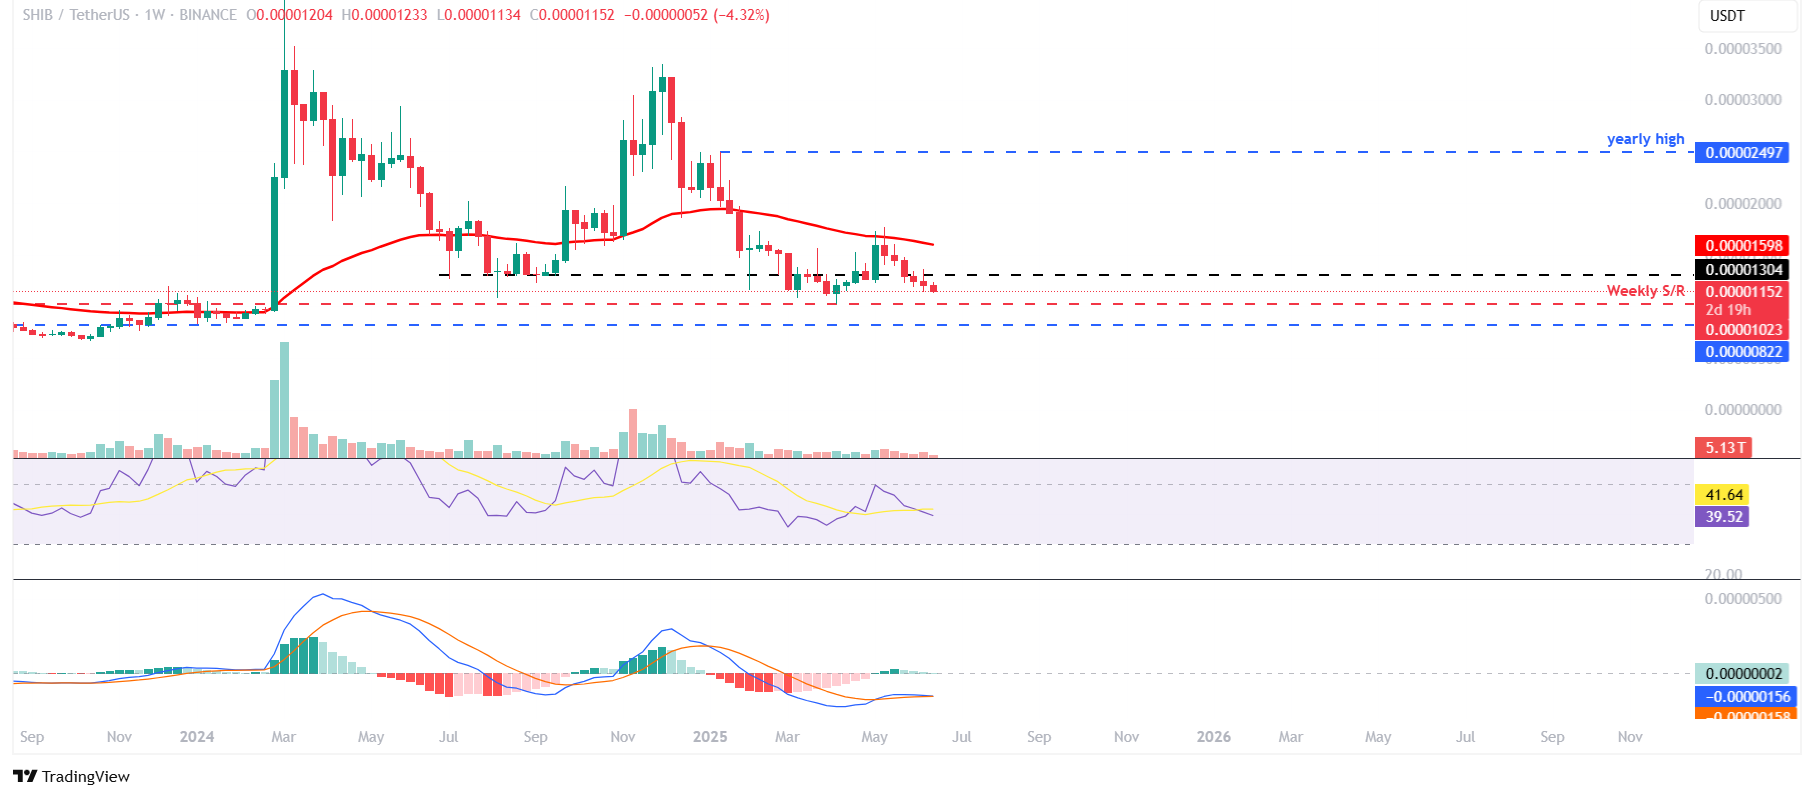
SHIB/USDT weekly chart
On the contrary, if SHIB recovers, it could extend the recovery toward its next weekly resistance at $0.000013.
Information on these pages contains forward-looking statements that involve risks and uncertainties. Markets and instruments profiled on this page are for informational purposes only and should not in any way come across as a recommendation to buy or sell in these assets. You should do your own thorough research before making any investment decisions. FXStreet does not in any way guarantee that this information is free from mistakes, errors, or material misstatements. It also does not guarantee that this information is of a timely nature. Investing in Open Markets involves a great deal of risk, including the loss of all or a portion of your investment, as well as emotional distress. All risks, losses and costs associated with investing, including total loss of principal, are your responsibility. The views and opinions expressed in this article are those of the authors and do not necessarily reflect the official policy or position of FXStreet nor its advertisers. The author will not be held responsible for information that is found at the end of links posted on this page.
If not otherwise explicitly mentioned in the body of the article, at the time of writing, the author has no position in any stock mentioned in this article and no business relationship with any company mentioned. The author has not received compensation for writing this article, other than from FXStreet.
FXStreet and the author do not provide personalized recommendations. The author makes no representations as to the accuracy, completeness, or suitability of this information. FXStreet and the author will not be liable for any errors, omissions or any losses, injuries or damages arising from this information and its display or use. Errors and omissions excepted.
The author and FXStreet are not registered investment advisors and nothing in this article is intended to be investment advice.
Recommended Content
Editors’ Picks

Semler Scientific reveals plans to buy 105,000 BTC by 2027
Semler Scientific (SMLR) announced a three-year plan on Thursday to boost its Bitcoin holdings to 105,000 BTC by the end of 2027. The announcement comes after it appointed a new executive to spearhead its Bitcoin strategy.

Ethereum Price Forecast: ETH network growth explodes as GENIUS Bill advances
Ethereum (ETH) is trading around $2,500 in the early Asian session on Friday despite a surge in new address growth over the past month. The development follows progress in digital assets regulations after the Guiding and Establishing National Innovation for US Stablecoins (GENIUS) bill passed the Senate.

Top 3 Price Prediction: Bitcoin, Ethereum, Ripple – BTC, ETH, XRP consolidate as traders await Trump’s decision
Bitcoin (BTC) price is hovering above the key support level on Friday; a breach below this level could trigger a sharp decline. Ethereum (ETH) and Ripple (XRP) followed BTC’s footsteps and stabilized around their crucial levels, with a failure below their support levels indicating a potential correction ahead.

Top Crypto Gainers: OKB, Sei, Bitcoin Cash – Altcoins shine through amid market volatility
The top cryptocurrencies in the market remain quiet at crucial support levels, while some altcoins experience a bullish spark. Top performers over the last 24 hours include OKB (OKB), Sei (SEI), and Bitcoin Cash (BCH) with over 8% recovery and key resistance breakouts.

Bitcoin: BTC could slump to $100K amid Trump-Musk tussle
Bitcoin (BTC) tumbled to a low of $101,095 on Friday amid volatility in the market. The effect of the tussle between United States (US) President Donald Trump and Tesla Chief Elon Musk negatively influenced the NASDAQ and Tesla's stock price on Thursday, although both are recovering on Friday.

The Best brokers to trade EUR/USD
SPONSORED Discover the top brokers for trading EUR/USD in 2025. Our list features brokers with competitive spreads, fast execution, and powerful platforms. Whether you're a beginner or an expert, find the right partner to navigate the dynamic Forex market.